
Here are some of the most interesting data points from recent industry reports to help you stay on top of the latest intelligence around meetings and events.
[Related: More Meetings and Events Industry Trends]
Meetings Industry Trends Snapshot: June
Planners Pick In-Person Events
70% of planners expect the number of in-person meetings to increase by up to 20% in 2026.
Source: Cvent Planner Sourcing Report 2026
Why it matters: After much uncertainty in the business world regarding federal government actions in the last two years, it seems organizations are bullish about the need to meet in person to build relationships and spur business.
Money Talks
Planners found that the two biggest costs eating up their budgets are F&B (73%) and audiovisual (66%).
Source: Statista
Why it matters: Food prices continue to rise; especially coffee prices for conference settings. Audiovisual add-ons and fees are a perennial pain point for planners.
[Related: Tracy Stuckrath's Essential Meetings F&B Checklist]
Good Year for Group Travel
86% of business travelers said they will travel more as a group this year in comparison to last year.
Source: Navan State of Corporate Travel & Expense 2026
Why it matters: U.S. Travel Association’s “U.S. Group Travel Report: Strength Beneath the Surface” reinforces that group travel delivers more than economic impact and fosters trust in ways that cannot be replicated virtually.
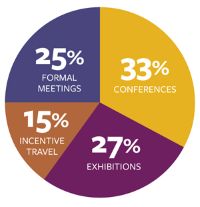
Meetings That Make Up the MICE Market
An overview of the MICE market found that conferences account for 33% of event value, exhibitions 27%, incentive travel 15% and formal meetings 25% of market activity.
Source: Meetings, Incentives, Conventions and Exhibitions (MICE) Market Overview by Industry Research
Why it matters: The MICE market in the U.S. represents 25% of global event volume, hosting 300,00 events annually with an average number of 1,300 attendees.
Meetings Industry Trends Snapshot: May
Big Easy Bleisure
New Orleans was ranked the No. 1 bleisure destination in the U.S.
Source: Booking.com for Business
Why it matters: New Orleans is a popular destination for business professionals to extend their stay because it offers an array of museums, galleries, cultural landmarks, scenic outdoor spots and virtually nonstop music and nightlife options.
City’s Choice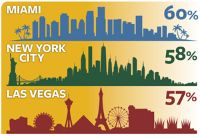
Planners prefer major cities, with 60% naming Miami, 58% New York City and 57% Las Vegas as their most likely destination in the next two years.
Source: MMGY Travel Intelligence 2026 Portrait of Meeting Planners & Attendees
Why it matters: Choosing a city as a destination for an event ensures convenient, and often nonstop, flights, lots of options for distinctive experiences and venues, and more resources close at hand.
Employee Engagement
74.3% of professionals say employee engagement is the primary reason for hosting meetings and events.
Source: FCM Meetings & Events 2026 Global Trends Report
Why it matters: Meetings with employee engagement as the driving motivation typically feature programming focused on culture, connection, networking and workforce development.
Stay Safe!

78.9% of meeting planners name safety and security as their No. 1 planning priority.
Source: FCM Meetings & Events 2026 Global Trends Report
Why it matters: Planners always need to be prepared with contingency plans in case of emergency, and it’s no secret that with the current state of the world, mitigation and risk management best practices remain top of mind.
Meetings Industry Trends Snapshot: April
Pay the Price 
North America’s average hotel daily room rate is projected to increase by only 0.6% to $166 this year compared to $163 in 2025.
Source: CWT/GBTA 2026 Annual Global Business Travel Forecast
Why it matters: Airfares, hotels and car rental prices are set to stabilize further over the next 18 months despite inflation and economic uncertainty, meaning products are catching up with demand.
Meeting Planners Where They Are
The average cost per attendee per day for meetings and events is projected to decrease by 1.3% in 2026 to $172.
Source: CWT/GBTA 2026 Annual Global Business Travel Forecast
Why it matters: This is good news for planners who have experienced budget cuts. Considering these cuts and the lower cost per attendee, planners could continue lowering cost by considering secondary cities where hotel and venue rates are lower.
Living Luxury 
As of 2025, the U.S. hotel pipeline features more than 28,000 luxury rooms—which is a 17% increase from 2024.
Source: Deloitte 2026 Travel Industry Outlook
Why it matters: The industry continues to trend toward high-end travel. Luxury hotel performance continues to grow steadily while economy hotel performance dips.
Gen Z’s Generational Shift
At the end of the 2025 holiday travel season, Gen Z and millennials combined accounted for half of all travelers in the U.S.
Source: Deloitte 2026 Travel Industry Outlook
Why it matters: In this generational shift, Gen Z and millennials now dominate demand in the U.S. travel industry. It’s no surprise that Gen Z—known for their investment in the “experience economy”—is one of the generations planning the most trips.
[Related: The Z: Planning for the Industry’s Next Generation]
Meetings Industry Trends Snapshot: March
Concrete Jungle
New York City is projected to open the most U.S. hotel rooms in 2026, totaling 4,852.
Source: CoStar
Why it matters: For the second year in a row, New York leads the U.S. pipeline, perhaps impacting site selection decisions and ADR in the largest metro in the nation.
Industry Increase
Over the next 10 years, the event tourism market’s compound annual growth rate is 4.3%.
Source: Future Market Insights Inc.
Why it matters: According to the survey, the increasing popularity of experiential travel and business events is fueling growth and shifting strategies.
Time to Travel
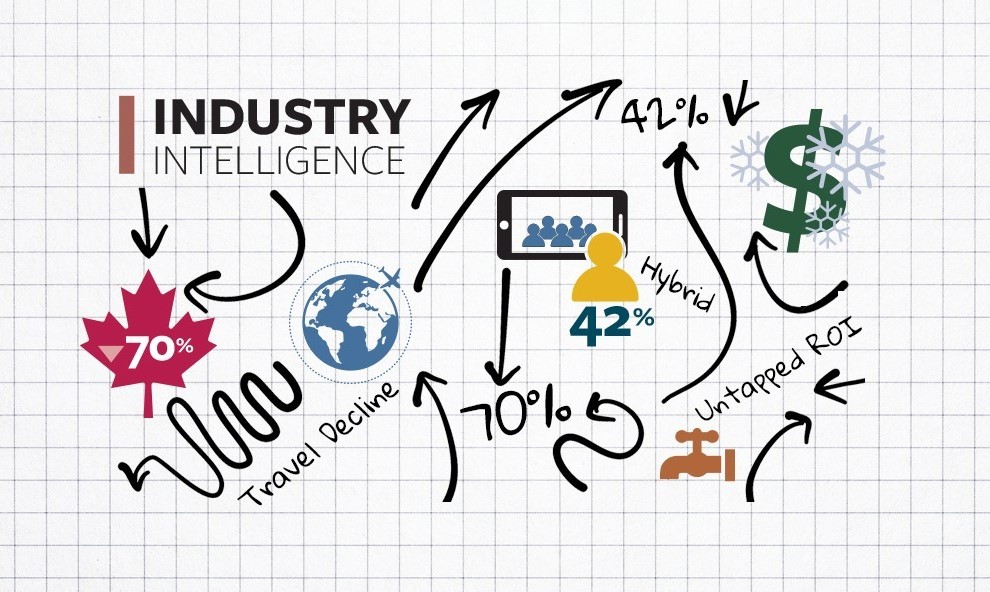
Compared to 2025, 42% of travel managers expect the number of employee travelers at their organization to increase in 2026.
Source: GBTA January 2026 poll
Why it matters: An expected increase in business travel is a good general indicator of the health both of that segment and also the in-person business events industry.
Hyatt’s New Heights
Hyatt’s newest brands—Unscripted by Hyatt, Hyatt Select and Hyatt Studios—made up more than 65% of all new U.S. deals in 2025.
Source: Hyatt Newsroom
Why it matters: Hyatt’s pipeline reflects changing consumer preferences in hotel design and features.
[Related: Brand Breakdown of the 4 Largest Meetings-Focused Hotel Companies]
Meetings Industry Trends Snapshot: January/February
The Future is Bright
85% of meeting professionals are optimistic about the industry in 2026.
Source: Amex GBT’s 2026 Global Meetings & Events Forecast
Why it matters: Optimism is reported to be the highest on record in the last five years.
Global Growth
Gross bookings for global travel grew to $1.67 trillion in 2025. This is an increase from $1.58 trillion in 2024.
Source: Travel Forward’s Data, Insights and Trends for 2026
Why it matters: Amid global uncertainty, travel not only endures but also extends beyond pre-pandemic benchmarks.
Business or Pleasure? 
63% of business travelers in the U.S. stated they have extended a business trip for leisure purposes.
Source: Amex GBT’s Meet Tomorrow’s Business Travelers
Why it matters: Six in 10 business travelers are mixing business with leisure by taking bleisure trips. The proportion of travelers adding business meetings to leisure trips is 53%.
Connection is Key

88% of event professionals surveyed said their favorite industry digital channel to engage with is LinkedIn.
Source: Convene’s Annual Meetings Market Survey
Why it matters: Digital engagement on other social media platforms is not well represented; 29%-33% of professionals selected Instagram and Facebook as their favorite digital channels to engage with, while only 7% selected X.
Meetings Industry Trends Snapshot: November/December
Across the Globe
Airline data insights show a 2% increase in international flight searches to North America, as opposed to a 28% increase in international flight searches from North America to other countries across the globe.
Why it matters: International travelers have only indicated a slight increase in desire to travel to North America. Global markets like Italy, Japan and France saw an increase in bookings.
Source: Amadeus Navigator360 data, as of August 15th, 2025.
Comparing Costs
54% of travel managers say cost is one of the top factors that led to a decline in business travel this year; 68% of travel managers expect to expand travel budgets for 2026.
Why it matters: In 2025, the percentage of people traveling for work declined, and while travel budgets may be increasing, so are costs.
Source: Deloitte Corporate Travel Forecast
Sustainable City
The number of nights spent by international tourists in Helsinki, Finland, which has been marketing itself as a sustainable destination, has increased by 19% in the first seven months of 2025.
Why it matters: Helsinki was ranked the world’s most sustainable tourist destination for the second year in a row, indicating that a growing number of tourists are looking for more sustainable destinations. 
Source: Global Destination Sustainability (GDS) Index/ Statistics Finland’s accommodation statistics
Training Wheels
Only 7%-8% of event leaders dedicate their time to learning.
Why it matters: Event leaders appear to not have the capacity to dedicate time and budget to training and development.
Source: “Future-Ready Leadership” by Event Leaders Exchange (ELX)/Skift Meetings
Meetings Industry Trends Snapshot: October
Mentors Matter
76% of people think mentors are important, but only 37% of people currently have one. And people with mentors are happier in their jobs than people who don’t have one.

Source: Forbes/Olivet Nazarene University
Why it matters: With so many retirees exiting the industry and so many fresh Gen Z faces entering, it’s more important than ever to find a mentor or serve as one in order to pass down knowledge and lessons learned to the next generation.
AI Adoption
14% of meeting planners view artificial intelligence as a critical technology, up from just 4% in 2024.
Source: IACC & DCI 2025 Meeting Room of the Future report
Why it matters: While the share of meeting planners viewing AI as critical remains the minority, the rapid rise in the utilization of AI suggests the technology could become widely adopted in the coming years.
Canadian Car Decline
Canadian travel to the U.S. continues to decline, with car visits plunging 37% in July compared to the previous year, marking the seventh consecutive month of double-digit declines in Canadian visitation to the U.S.
Source: Forbes.
Why it matters: Canadians spent $20.5 billion in the U.S. in 2024, and these declines will only continue to hurt the U.S. travel market. The U.S. Travel Association projects that every 1% drop in international visitor spending costs the U.S. $1.8 billion in export revenue.

To RFP or Not to RFP
Of the travel managers who negotiate directly with hotels, 36% negotiate entirely outside of a formal RFP process.
Source: GBTA Hotel and Meeting Sourcing report.
Why it matters: While informal negotiations might be tempting for some buyers, it’s important to note that having a defined sourcing process can help save money, standardize the process and allow buyers to compare venues.
Meetings Industry Trends Snapshot: September
Business Travel Troubles
48% of suppliers and 34% of buyers expect a decline in business travel volume in the remainder of 2025.
Source: GBTA July global poll
Why it matters: Despite reports of business travel being on the rise in some areas, that data has not convinced suppliers or buyers to become optimistic about the future of the industry amid growing economic uncertainty and the ripple effects of U.S. government actions.
 Risky Business
Around 79% of business travelers admit to taking risks on work trips they’d never consider at home, such as ignoring local safety advice or getting into cars with strangers.
Source: World Travel Protection
Why it matters: This increase in risky behavior can carry massive consequences for companies such as legal troubles and reputational damage. This makes the topic of risk management more important than ever for companies.
 Out-of-Pocket Spending
A survey of 500 corporate travelers found that 63% of travelers spend their own money on meals while traveling for business and that corporate travelers spend an extra $700 beyond their designated budget per business trip.
Source: Booking.com for Business
Why it matters: With so many business travelers spending their own money while on the road, this increases the importance of incorporating all-paid dining options into business travel budgets, which may alleviate overall concerns about how inflation is “eating” into paychecks.
Continued Increasing Costs
71% of travel managers expect costs in 2025 to be higher than in 2024.
Source: 2025 Global Cvent Travel Managers Report
[Related: 2025 Meetings Today Trends Survey]
Meetings Industry Trends Snapshot: July/August
End of Hybrid Era
42% of planners said they do not plan to incorporate live streaming during their events, reflecting a trend away from hybrid events.
Source: IACC & DCI 2025 Meeting Room of the Future report
Why it matters: Planners relying less on hybrid event options, which have historically helped increase attendance rates at events, may be another symptom of rising AV costs and decreasing budgets.

Funding Freeze
42% of destination marketing organizations (DMOs) foresee funding risks within the next three years.
Source: 2025 DestinationNEXT Futures Study
Why it matters: Many destinations rely on the business garnered from meetings and events to bolster their economy, but planners might have less support and assistance from DMOs for their events if funding is cut.
Canada Crossings
Passenger bookings on Canada–U.S. airline routes are currently down by 70% compared to the same period in 2024.
Source: OAG
Why it matters: A decrease in Canadians willing to visit the U.S. could have major consequences for U.S.-based events, especially those held in destinations most visited by Canadians such as Florida, California, Nevada, New York and Texas.

Untapped ROI
A new return-on-investment study suggests that U.S. companies could gain $14.60 for every $1 invested in business travel, marking $2.4 trillion in untapped sales revenue from business travel.
Source: 2025 GBTA U.S. ROI Study
Why it matters: U.S. companies are underinvesting in business travel, which suggests the market potential for the MICE industry is much higher than previously estimated.
 Inbound Travel Decline
According to a new study, international travel spending in the U.S. is expected to decline about 7%, or $12.5 billion, in 2025.
Source: World Travel and Tourism Council
Why it matters: As international markets sour on traveling or hosting their events in the U.S., many organizations that rely on international attendees might experience a corresponding attendance decrease in the months and years to come.